Difference between revisions of "Pie Chart/pt-br"
(Created page with "Para outras opções de gráfico, veja Objetos.") |
(Created page with "'''Exemplo'''") |
||
| Line 9: | Line 9: | ||
| − | ''' | + | '''Exemplo''' |
[[File:piechart_ex.png|link=]] | [[File:piechart_ex.png|link=]] | ||
Revision as of 19:43, 7 April 2014
Veja o tutorial em vídeo sobre gráficos de pizza (em inglês).
Um objeto de Gráfico de Pizza representa os dados como fatias de um círculo, cujo tamanho é determinado pelos valores dos dados.
O Gráfico de Pizza precisa de uma coluna de Data ou Texto que será usada para agrupar os dados e de uma coluna de Valor que será usada para determinar os tamanhos das fatias no gráfico.
Para outras opções de gráfico, veja Objetos.
Exemplo
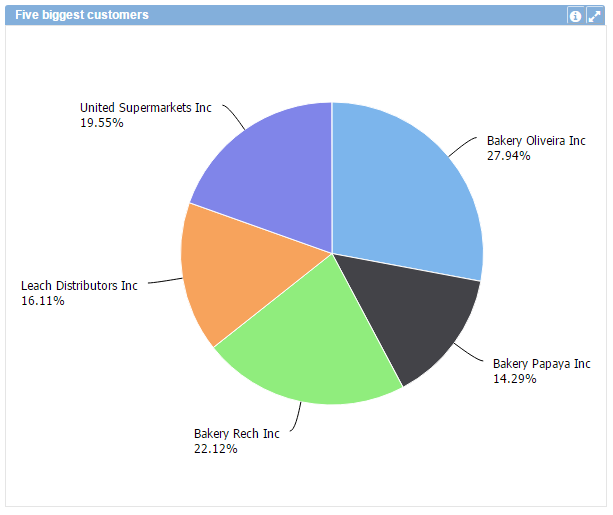
In the above example the chart displays the percentage of participation in the Profit amount of the Five (limited by Row limit) biggest Customers.
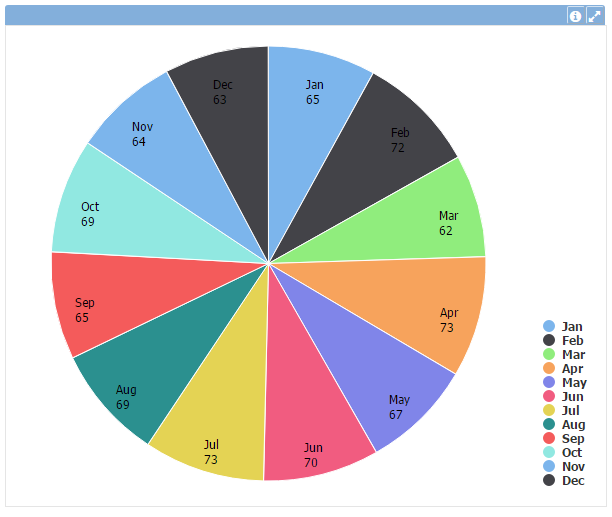
This other example, show the number of unique customers in each month of the year using the count distinct for the Function property.
Data Properties
Title Bar Properties
Layout Properties
- Background color
- Border color
- Font size
- Hide values
- Labels position
- Legend position
- Object dimensions
- Show value as
- Object positions
Object Columns Properties