Difference between revisions of "Column Chart"
(Marked this version for translation) |
|||
| Line 1: | Line 1: | ||
<translate> | <translate> | ||
| + | <!--T:1--> | ||
A Column Chart object that represents data as a series of vertical columns whose height is determined by the values in the data. | A Column Chart object that represents data as a series of vertical columns whose height is determined by the values in the data. | ||
| + | <!--T:2--> | ||
The Column Chart object needs one [[Date]] or [[Text]] column that will be used to group data and supports [[Value|values]] columns that will be show as the columns in the chart. | The Column Chart object needs one [[Date]] or [[Text]] column that will be used to group data and supports [[Value|values]] columns that will be show as the columns in the chart. | ||
| + | <!--T:3--> | ||
For other chart options, see [[Objects]]. It is also possible to create combined charts by changing the [[Series Type]] property of the [[Value]] columns. | For other chart options, see [[Objects]]. It is also possible to create combined charts by changing the [[Series Type]] property of the [[Value]] columns. | ||
| + | <!--T:4--> | ||
'''Examples''' | '''Examples''' | ||
| + | <!--T:5--> | ||
[[File:colchart_ex.png|link=]] | [[File:colchart_ex.png|link=]] | ||
| + | <!--T:6--> | ||
In the above example the chart displays the ''Quantity'', ''Taxes'' and ''Profit'' by company ''Branch''. | In the above example the chart displays the ''Quantity'', ''Taxes'' and ''Profit'' by company ''Branch''. | ||
| + | <!--T:7--> | ||
[[File:colchart_ex2.png|link=]] | [[File:colchart_ex2.png|link=]] | ||
| + | <!--T:8--> | ||
In this example the chart displays the [[Stacking|Stacked]] values of ''Taxes'' and ''Cost'' by ''Month'' using different [[Layout Properties]]. | In this example the chart displays the [[Stacking|Stacked]] values of ''Taxes'' and ''Cost'' by ''Month'' using different [[Layout Properties]]. | ||
| + | <!--T:9--> | ||
[[File:combined_chart.png|link=]] | [[File:combined_chart.png|link=]] | ||
| + | <!--T:10--> | ||
This example shows the 'Cost', 'Profit' and 'Net Revenue' values using different [[Series Type]] (column, area and line). | This example shows the 'Cost', 'Profit' and 'Net Revenue' values using different [[Series Type]] (column, area and line). | ||
| + | <!--T:11--> | ||
'''Data Properties''' | '''Data Properties''' | ||
| + | <!--T:12--> | ||
* [[Advanced row filter]] | * [[Advanced row filter]] | ||
* [[Column order]] | * [[Column order]] | ||
| Line 37: | Line 49: | ||
| + | <!--T:13--> | ||
'''Title Bar Properties''' | '''Title Bar Properties''' | ||
| + | <!--T:14--> | ||
* [[Title bar Properties]] | * [[Title bar Properties]] | ||
| + | <!--T:15--> | ||
'''Layout Properties''' | '''Layout Properties''' | ||
| + | <!--T:16--> | ||
* [[Background color]] | * [[Background color]] | ||
* [[Border color]] | * [[Border color]] | ||
| Line 54: | Line 70: | ||
| + | <!--T:17--> | ||
'''Object Columns Properties''' | '''Object Columns Properties''' | ||
| + | <!--T:18--> | ||
* [[Column filters]] | * [[Column filters]] | ||
* [[Column label]] | * [[Column label]] | ||
Revision as of 13:24, 2 April 2014
A Column Chart object that represents data as a series of vertical columns whose height is determined by the values in the data.
The Column Chart object needs one Date or Text column that will be used to group data and supports values columns that will be show as the columns in the chart.
For other chart options, see Objects. It is also possible to create combined charts by changing the Series Type property of the Value columns.
Examples
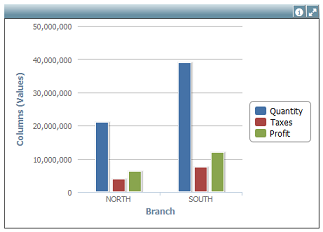
In the above example the chart displays the Quantity, Taxes and Profit by company Branch.
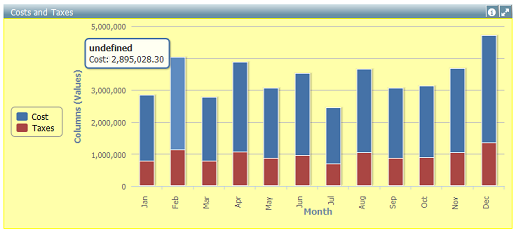
In this example the chart displays the Stacked values of Taxes and Cost by Month using different Layout Properties.
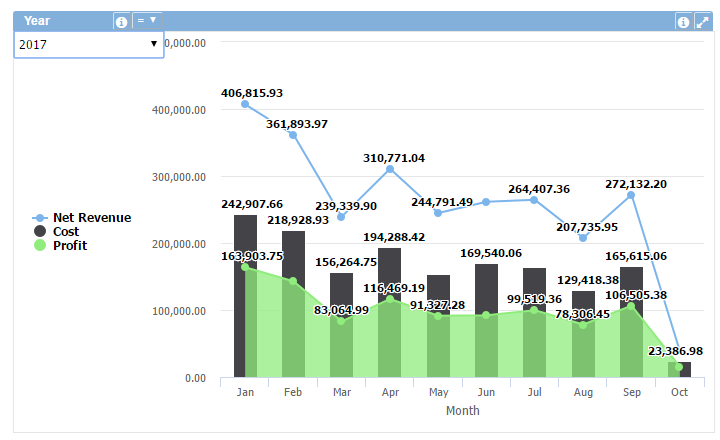
This example shows the 'Cost', 'Profit' and 'Net Revenue' values using different Series Type (column, area and line).
Data Properties
- Advanced row filter
- Column order
- Decimal (Y axis)
- Filters
- Row limit
- Rows sort
- Stacking
- Thousand sep. (Y axis)
- Total row
Title Bar Properties
Layout Properties
- Background color
- Border color
- Font size
- Hide labels
- Labels rotation
- Legend position
- Object dimensions
- Object positions
Object Columns Properties