Cross Area Chart
A Cross Area Chart object that represents data as filled areas whose height is determined by the values in the data.
The Cross Area Chart object needs two Dates or Texts columns (or one of each) that will be used to group data and one Value column that will be shown as the filled areas in the chart.
For other chart options, see Objects.
Example
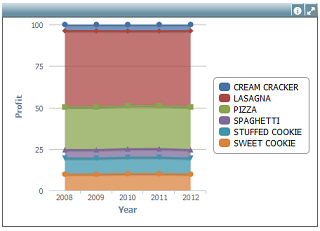
The first chart example displays the Stacking percentage values of Products Profit throught Years.
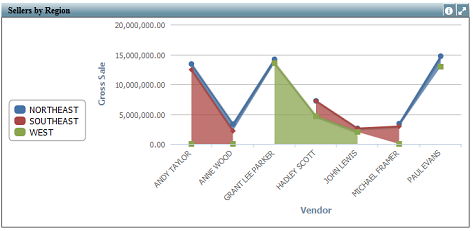
In the above example the area chart displays the stacked Gross Sale values of Vendors by Region.
See below all available properties for this object:
- Data Properties:
- Category Axis Properties:
- Values Axis Properties:
- Series Properties:
- Legend Properties:
- Title Bar Properties:
- Layout Properties:
- Column Properties: