Difference between revisions of "Cross Column Chart"
(Marked this version for translation) |
|||
| Line 1: | Line 1: | ||
<translate> | <translate> | ||
| + | <!--T:1--> | ||
A Cross Column Chart object that represents data as a series of grouped vertical columns whose height is determined by the values in the data. | A Cross Column Chart object that represents data as a series of grouped vertical columns whose height is determined by the values in the data. | ||
| + | <!--T:2--> | ||
The Cross Column Chart object needs two [[Date]] or [[Text]] columns (or one of each) that will be used to group data and one [[Value]] column that will be show as the columns in the chart. | The Cross Column Chart object needs two [[Date]] or [[Text]] columns (or one of each) that will be used to group data and one [[Value]] column that will be show as the columns in the chart. | ||
| + | <!--T:3--> | ||
For other chart options, see [[Objects]]. | For other chart options, see [[Objects]]. | ||
| + | <!--T:4--> | ||
'''Example''' | '''Example''' | ||
| + | <!--T:5--> | ||
[[File:ccolchart_ex.png|link=]] | [[File:ccolchart_ex.png|link=]] | ||
| + | <!--T:6--> | ||
In the above example the chart displays the ''Products'' ''Gross Sale'' by company ''Branch'', showing also the [[Total column]]. | In the above example the chart displays the ''Products'' ''Gross Sale'' by company ''Branch'', showing also the [[Total column]]. | ||
| + | <!--T:7--> | ||
[[File:ccolchart_ex2.png|link=]] | [[File:ccolchart_ex2.png|link=]] | ||
| + | <!--T:8--> | ||
The second example displays the ''Products'' sales value by ''Year''. | The second example displays the ''Products'' sales value by ''Year''. | ||
| + | <!--T:9--> | ||
'''Data Properties''' | '''Data Properties''' | ||
| + | <!--T:10--> | ||
* [[Advanced row filter]] | * [[Advanced row filter]] | ||
* [[Average Column]] | * [[Average Column]] | ||
| Line 34: | Line 44: | ||
| + | <!--T:11--> | ||
'''Title Bar Properties''' | '''Title Bar Properties''' | ||
| + | <!--T:12--> | ||
* [[Title bar Properties]] | * [[Title bar Properties]] | ||
| + | <!--T:13--> | ||
'''Layout Properties''' | '''Layout Properties''' | ||
| + | <!--T:14--> | ||
* [[Background color]] | * [[Background color]] | ||
* [[Border color]] | * [[Border color]] | ||
| Line 51: | Line 65: | ||
| + | <!--T:15--> | ||
'''Object Columns Properties''' | '''Object Columns Properties''' | ||
| + | <!--T:16--> | ||
* [[Column filters]] | * [[Column filters]] | ||
* [[Column label]] | * [[Column label]] | ||
Revision as of 13:30, 2 April 2014
A Cross Column Chart object that represents data as a series of grouped vertical columns whose height is determined by the values in the data.
The Cross Column Chart object needs two Date or Text columns (or one of each) that will be used to group data and one Value column that will be show as the columns in the chart.
For other chart options, see Objects.
Example
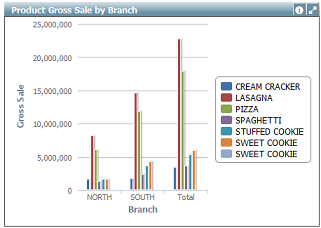
In the above example the chart displays the Products Gross Sale by company Branch, showing also the Total column.
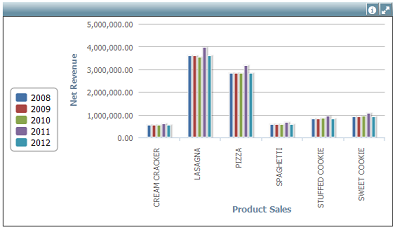
The second example displays the Products sales value by Year.
Data Properties
- Advanced row filter
- Average Column
- Decimal (Y axis)
- Filters
- Row limit
- Rows sort
- Stacking
- Thousand sep. (Y axis)
- Total column
- Total row
Title Bar Properties
Layout Properties
- Background color
- Border color
- Font size
- Hide labels
- Object dimensions
- Labels rotation
- Legend position
- Object positions
Object Columns Properties