Difference between revisions of "Gauge"
(Marked this version for translation) |
|||
| Line 1: | Line 1: | ||
<translate> | <translate> | ||
| + | <!--T:1--> | ||
'''See a [[Gauge Tutorial|video tutorial]] about the gauge object'''. | '''See a [[Gauge Tutorial|video tutorial]] about the gauge object'''. | ||
| + | <!--T:2--> | ||
A gauge chart that goes from minimum to maximum set interval, with different ranges markers between this interval and a dynamic indicator that points to the current value result. | A gauge chart that goes from minimum to maximum set interval, with different ranges markers between this interval and a dynamic indicator that points to the current value result. | ||
| + | <!--T:3--> | ||
For more information, see [[Gauge ranges]]. | For more information, see [[Gauge ranges]]. | ||
| + | <!--T:4--> | ||
'''Example''' | '''Example''' | ||
| + | <!--T:5--> | ||
[[File:Range_gauge.png|link=]] | [[File:Range_gauge.png|link=]] | ||
| + | <!--T:6--> | ||
The example above shows a gauge with the interval going from ''0'' to ''10,000'', different fixed ranges between this interval (red, yellow and blue colors) that show the value performance and the dynamic pointer indicating the current value of the measure ''6187.73''. | The example above shows a gauge with the interval going from ''0'' to ''10,000'', different fixed ranges between this interval (red, yellow and blue colors) that show the value performance and the dynamic pointer indicating the current value of the measure ''6187.73''. | ||
| + | <!--T:7--> | ||
[[File:Range_gauge2.png|link=]] | [[File:Range_gauge2.png|link=]] | ||
| + | <!--T:8--> | ||
The example above shows two gauges that measure the percentage variation over time and seller. | The example above shows two gauges that measure the percentage variation over time and seller. | ||
| + | <!--T:9--> | ||
'''Data Properties''' | '''Data Properties''' | ||
| + | <!--T:10--> | ||
* [[Object Filters|Filters]] | * [[Object Filters|Filters]] | ||
* [[Gauge ranges]] | * [[Gauge ranges]] | ||
| + | <!--T:11--> | ||
'''Title Bar Properties''' | '''Title Bar Properties''' | ||
| + | <!--T:12--> | ||
* [[Title bar Properties]] | * [[Title bar Properties]] | ||
| + | <!--T:13--> | ||
'''Layout Properties''' | '''Layout Properties''' | ||
| + | <!--T:14--> | ||
* [[Background color]] | * [[Background color]] | ||
* [[Border color]] | * [[Border color]] | ||
| Line 40: | Line 54: | ||
| + | <!--T:15--> | ||
'''Object Columns Properties''' | '''Object Columns Properties''' | ||
| + | <!--T:16--> | ||
* [[Column filters]], | * [[Column filters]], | ||
* [[Column name]] | * [[Column name]] | ||
Revision as of 13:40, 2 April 2014
See a video tutorial about the gauge object.
A gauge chart that goes from minimum to maximum set interval, with different ranges markers between this interval and a dynamic indicator that points to the current value result.
For more information, see Gauge ranges.
Example
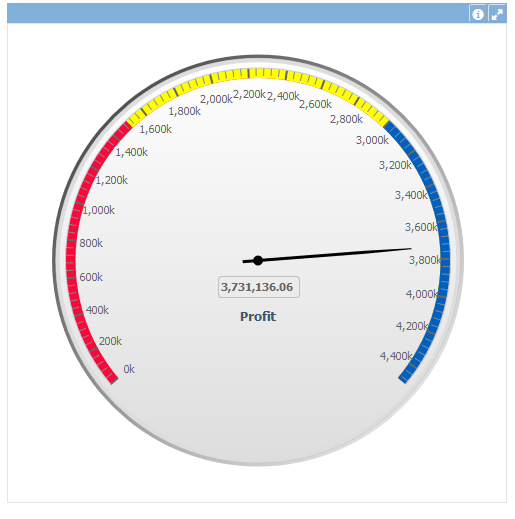
The example above shows a gauge with the interval going from 0 to 10,000, different fixed ranges between this interval (red, yellow and blue colors) that show the value performance and the dynamic pointer indicating the current value of the measure 6187.73.
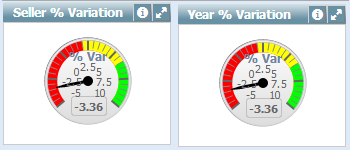
The example above shows two gauges that measure the percentage variation over time and seller.
Data Properties
Title Bar Properties
Layout Properties
Object Columns Properties