Difference between revisions of "Gauge/pt-br"
(Created page with "O exemplo acima mostra um gauge com os intervalos indo de ''0'' a ''10.000', diferentes alcances fixos neste intervalo (cores vermelho, amarelo e azul) que mostram a performan...") |
(Created page with "link=") |
||
| Line 15: | Line 15: | ||
| − | [[File: | + | [[File:Gauge 1.PNG|link=]] |
The example above shows two gauges that measure the percentage variation over time and seller. | The example above shows two gauges that measure the percentage variation over time and seller. | ||
Revision as of 20:19, 10 April 2014
Veja um tutorial em vídeo sobre o Gauge.
Um gráfico de gauge vai de um intervalo mínimo até um máximo pré-definidos, com diferentes alcances entre cada intervalo e um indicador dinâmico que aponta para o resultado do valor atual.
Para mais informações, veja Indicadores de alcance.
Exemplo
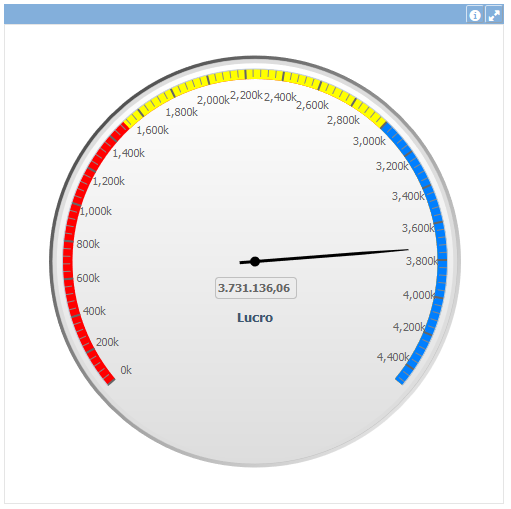
O exemplo acima mostra um gauge com os intervalos indo de 0 a 10.000', diferentes alcances fixos neste intervalo (cores vermelho, amarelo e azul) que mostram a performance do valor e o ponteiro dinâmico indicando o valor atual, 8.787,00.
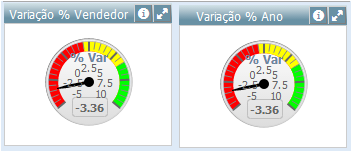
The example above shows two gauges that measure the percentage variation over time and seller.
Data Properties
Title Bar Properties
Layout Properties
Object Columns Properties