Gauge
Veja um tutorial em vídeo sobre o Gauge.
Um gráfico de gauge vai de um intervalo mínimo até um máximo pré-definidos, com diferentes alcances entre cada intervalo e um indicador dinâmico que aponta para o resultado do valor atual.
Para mais informações, veja Indicadores de alcance.
Exemplo
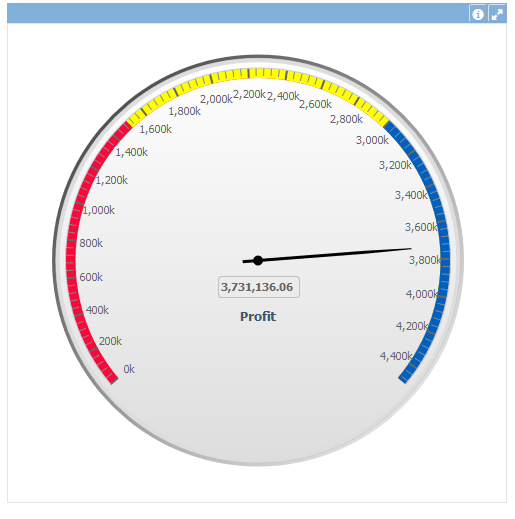
The example above shows a gauge with the interval going from 0 to 10,000, different fixed ranges between this interval (red, yellow and blue colors) that show the value performance and the dynamic pointer indicating the current value of the measure 6187.73.
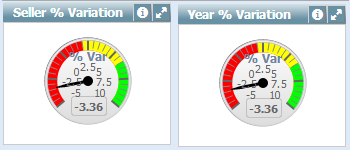
The example above shows two gauges that measure the percentage variation over time and seller.
Data Properties
Title Bar Properties
Layout Properties
Object Columns Properties