Difference between revisions of "Pie Chart/en"
(Importing a new version from external source) |
(Updating to match new version of source page) |
||
| (9 intermediate revisions by the same user not shown) | |||
| Line 2: | Line 2: | ||
| − | ''' | + | [[File:mainmenu5.png]] |
| + | '''Watch a [[Pie Chart Tutorial|video tutorial]] about the pie chart object'''. | ||
| Line 21: | Line 22: | ||
[[File:piechart_ex2.png|link=]] | [[File:piechart_ex2.png|link=]] | ||
| − | This other example | + | This other example shows the number of unique customers forn each month of the year using the count distinct for the [[Function]] property. |
| Line 30: | Line 31: | ||
** [[Object Filters|Filters]] | ** [[Object Filters|Filters]] | ||
** [[Rows sort|Rows Sort]] | ** [[Rows sort|Rows Sort]] | ||
| + | ** [[Drill Down]] | ||
** [[Advanced row filter|Advanced Row Filter]] | ** [[Advanced row filter|Advanced Row Filter]] | ||
** [[Row limit|Row Limit]] | ** [[Row limit|Row Limit]] | ||
| − | + | * [[Axis Values Properties]] | |
| − | |||
| − | |||
| − | |||
| − | |||
| − | + | * [[Legend_Properties]] | |
| − | |||
| − | |||
| − | |||
| − | |||
| − | + | * [[Title bar Properties|Title Bar Properties]] | |
| − | |||
| Line 61: | Line 54: | ||
* '''Column Properties''': | * '''Column Properties''': | ||
| − | ** [[Column name | + | ** [[Selected column]] |
| + | ** [[Column name]] | ||
** [[Data type|Data Type]] | ** [[Data type|Data Type]] | ||
** [[Column label|Column Label]] | ** [[Column label|Column Label]] | ||
Latest revision as of 02:23, 5 October 2022
 Watch a video tutorial about the pie chart object.
A Pie Chart object that represents data as slices of a circle whose size is determined by the values in the data.
The Pie Chart object needs one Date or Text column that will be used to group data and one Value column that will determine the slices size inside the chart.
For other chart options, see Objects.
Example
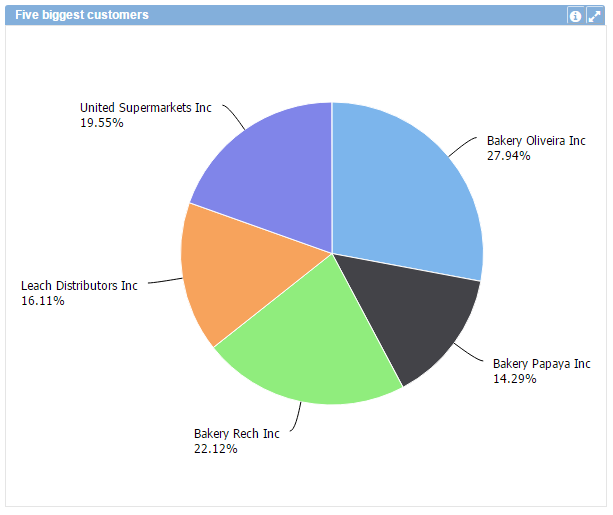
In the example above, the chart displays the percentage of participation in the Profit amount of the Five (limited by Row limit) biggest Customers.
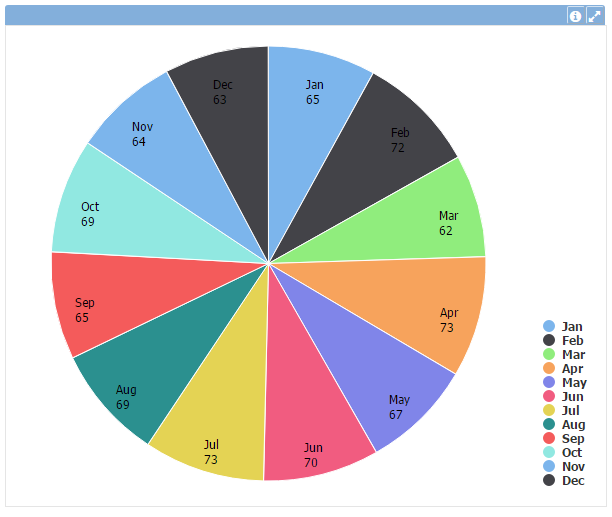
This other example shows the number of unique customers forn each month of the year using the count distinct for the Function property.
See below all available properties for this object:
- Data Properties:
- Layout Properties: