Difference between revisions of "Design Overview/en"
(Importing a new version from external source) |
(Updating to match new version of source page) |
||
| (14 intermediate revisions by the same user not shown) | |||
| Line 2: | Line 2: | ||
| − | ''' | + | [[File:mainmenu5.png]] |
| + | '''Watch the dashboards design environment [[Design Overview Tutorial|video tutorial]]'''. | ||
| Line 12: | Line 13: | ||
| − | [[File: | + | [[File:Visão Geral do Design+en-US.PNG|link=]] |
| Line 22: | Line 23: | ||
| − | == | + | == SideBar == |
| − | The | + | The sidebar contains three tabs: |
Latest revision as of 02:23, 5 October 2022
 Watch the dashboards design environment video tutorial.
The dashboards design environment allows creating and fully customize your dashboards.
To enter the dashboards design you must select edit or create a new dashboard by the options from the main page.
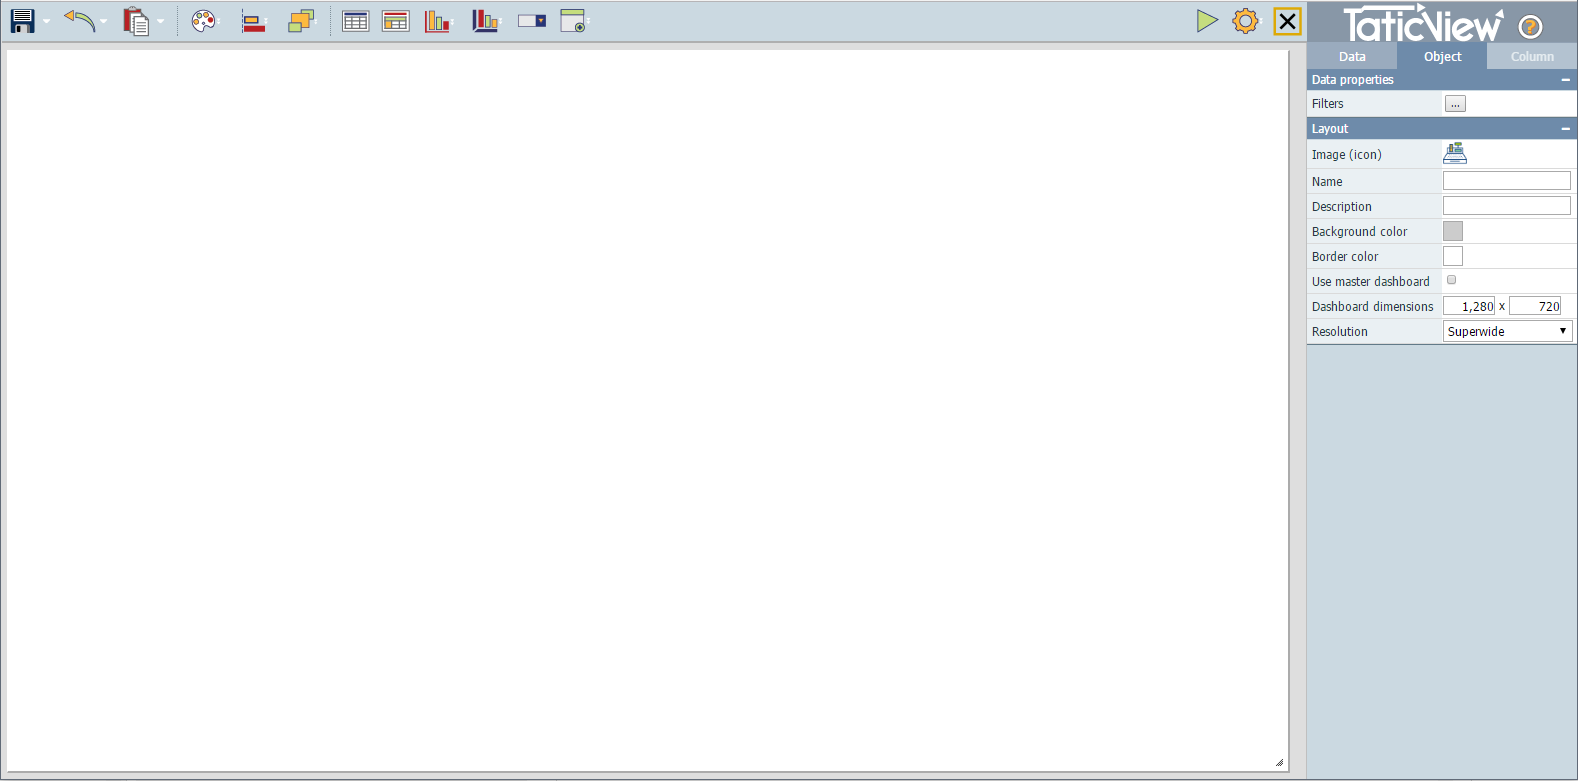
The dashboards design is divided into three main parts: top bar, side bar, and design area.

Top Bar
The top bar contains Design Options and Tools to help the design process and the Objects bar used to add objects to the dashboards.
SideBar
The sidebar contains three tabs:
- Data: Allows to check data sources fields and add columns to objects;
- Object: Allows to check and modify dashboard properties and objects properties;
- Column: Allows to check and modify columns properties.
Design Area
The design area is the big blank area in the middle of the screen. It is used to place, manage and organize objects in the way you want them to be view when running a dashboard. You must select the objects you want here before changing they properties.