Difference between revisions of "Area Chart/pt-br"
(Created page with "'''Exemplos'''") |
(Created page with "link=") |
||
| Line 8: | Line 8: | ||
'''Exemplos''' | '''Exemplos''' | ||
| − | [[File: | + | [[File:Cruzado1.PNG|link=]] |
In the above example the chart displays the ''Weight'' and ''Profit'' by the ''Products''. | In the above example the chart displays the ''Weight'' and ''Profit'' by the ''Products''. | ||
Revision as of 19:55, 2 April 2014
Um objeto de Gráfico de Área representa os dados como uma área preenchida, cuja altura é determinada pelos valores dos dados
O Gráfico de Área precisa de pelo menos uma coluna de Data ou Texto que será usada para agrupar os dados e colunas de Valores que serão mostrados como áreas preenchidas no gráfico.
Para outras opções de gráficos, veja Objetos. Também é possível criar gráficos combinados alterando a propriedade tipo de série da coluna de valor.
Exemplos
In the above example the chart displays the Weight and Profit by the Products.
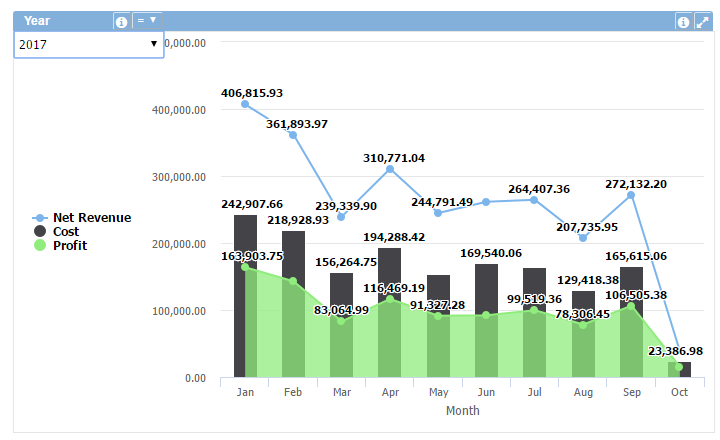
This example shows the 'Cost', 'Profit' and 'Net Revenue' values using different Series Type (column, area and line) for the April month selection.
Data Properties
- Advanced row filter
- Column order
- Decimal (Y axis)
- Filters
- Row limit
- Rows sort
- Stacking
- Thousand sep. (Y axis)
- Total row
Title Bar Properties
Layout Properties
- Background color
- Border color
- Font size
- Hide labels
- Labels rotation
- Legend position
- Object dimensions
- Object positions
Object Columns Properties