Line Chart
A Line Chart object that represents data as a series of lines connected dots whose height is determined by the values in the data.
The Line Chart object needs one Date or Text column that will be used to group data and supports values columns that will be shown as the lines and dots in the chart.
For other chart options, see Objects. It is also possible to create combined charts by changing the Series Type property of the Value columns.
Examples
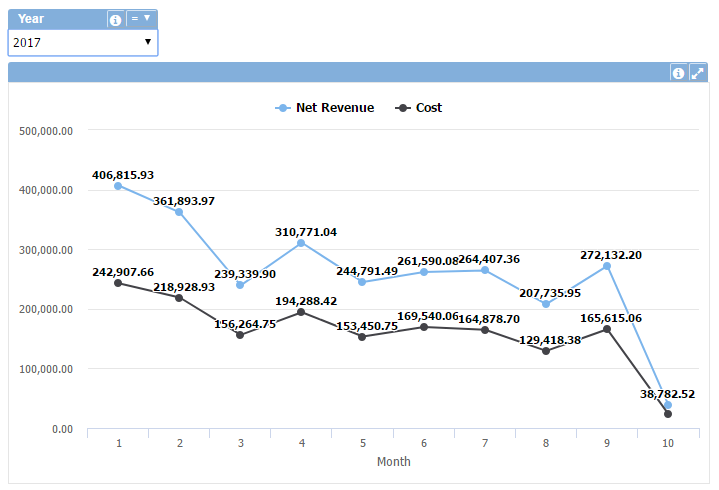
In the example above, the chart displays the Net Revenue and Cost by Month in 2017 (filtered with the help of the Combo (Filter) object).
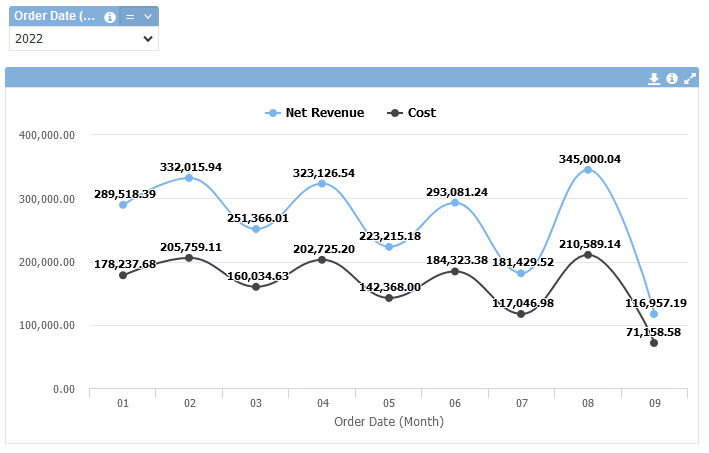
Like the fist sample, the image above, shows a Line Chart displays the Net Revenue and Cost by Month in 2022 using smoothed Lines
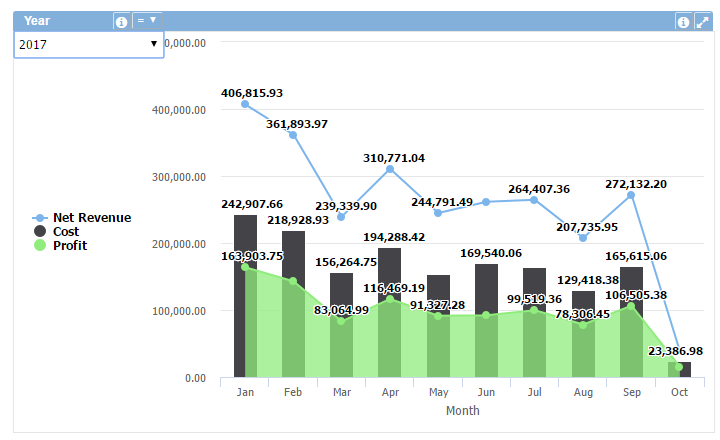
This example shows the Cost, Profit and Net Revenue values using different Series Type (column, area, and line) for the year selection.
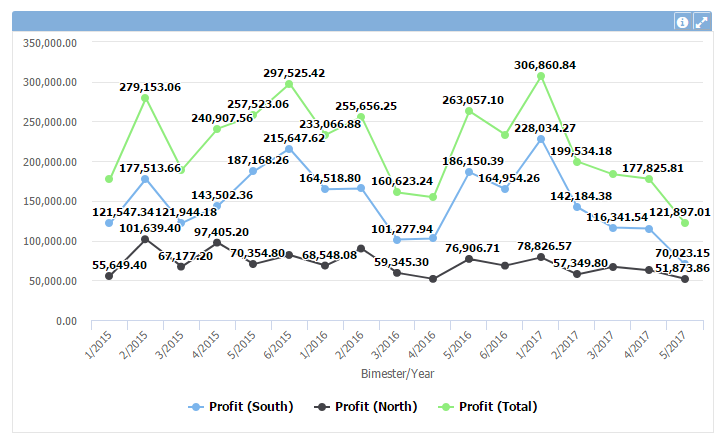
This example shows the Profit performance using different Column filters for each value to display each Branch and the general performance (no filter).
See below all available properties for this object:
- Data Properties:
- Category Axis Properties:
- Values Axis Properties:
- Series Properties:
- Legend Properties:
- Title Bar Properties:
- Layout Properties: