Tabela Cruzada
Veja o tutorial em vídeo sobre tabelas (em inglês).
Uma tabela, uma coleção de colunas e linhas, que exibe dados como uma visão cruzada de duas colunas de texto ou de data.
The Cross Table object needs two Date or Text columns (or one of each) and supports many Value columns.
The data displayed in the Cross Table will be a cross of the Data and Text columns with the first column being the row and the second the column. The Value columns will be shown summarized in the center.
In run-time cross tables have navigation buttons ![]() where you can change pages by clicking the arrows or typing the page number directly in the input box, the option to change the number of rows per page
where you can change pages by clicking the arrows or typing the page number directly in the input box, the option to change the number of rows per page ![]() and displays information
and displays information ![]() about current and total rows.
about current and total rows.
For simple table options, see Table.
Examples
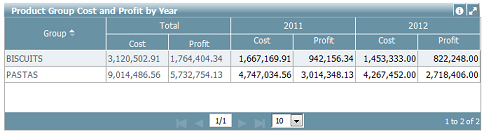
The above example, shows a cross table of Group (row) by Year (column) and the summarized ammount of Cost and Profit for these crossings.
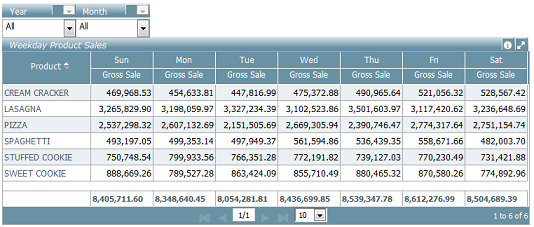
The second example, shows a Product by Weekday Gross Sales with the option to dynamic filter the object's data by Year and Month.
Data Properties
Title Bar Properties
Layout Properties
Object Columns Properties