Difference between revisions of "Cross Table"
| Line 10: | Line 10: | ||
| − | ''' | + | '''Examples''' |
| − | [[File:ctable_ex.png]] | + | [[File:ctable_ex.png|link=]] |
The above example, shows a cross table of ''Group'' (row) by ''Year'' (column) and the summarized ammount of ''Cost'' and ''Profit'' for these crossings. | The above example, shows a cross table of ''Group'' (row) by ''Year'' (column) and the summarized ammount of ''Cost'' and ''Profit'' for these crossings. | ||
| + | |||
| + | [[File:ctable_ex2.png|link=]] | ||
| + | |||
| + | The second example, shows a ''Product by Weekday Gross Sales'' with the option to dynamic [[Object Filters|filter]] the data by ''Year'' and ''Month''. | ||
Revision as of 17:52, 27 May 2013
A table like object, a collection of columns and rows, that displays data as a crossed view of two text or date columns.
The Cross Table object needs two Date or Text columns (or one of each) and supports many Value columns.
The data displayed in the Cross Table will be a cross of the Data and Text columns with the first column being the row and the second the column. The Value columns will be shown summarized in the center.
For simple table options, see Table.
Examples
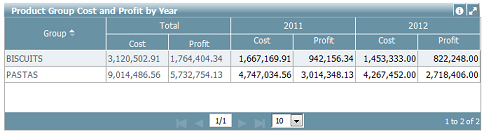
The above example, shows a cross table of Group (row) by Year (column) and the summarized ammount of Cost and Profit for these crossings.
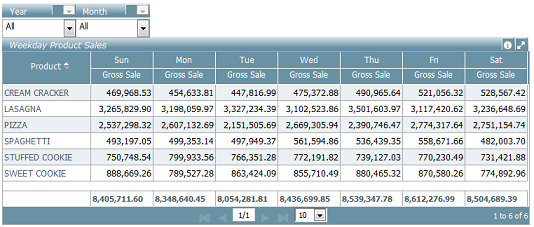
The second example, shows a Product by Weekday Gross Sales with the option to dynamic filter the data by Year and Month.
Data Properties
Title Bar Properties
Layout Properties
Object Columns Properties