Difference between revisions of "Table"
| Line 17: | Line 17: | ||
The above example, shows a table grouped by the ''Year'' and ''State'' columns (two first columns) and the summarized amount of ''Gross Sales'' and ''Net Revenue'' for these groups. | The above example, shows a table grouped by the ''Year'' and ''State'' columns (two first columns) and the summarized amount of ''Gross Sales'' and ''Net Revenue'' for these groups. | ||
| + | |||
| + | [[File:table_ex2.png|link=]] | ||
| + | |||
| + | Other example, using modified [[Layout Properties]], a [[Column filters|filtered column]] that displays only the ''Pizza Product Profit'' and a [[Special#Expression|expression]] to calculate the ''Pizza Profit'' percentage participation. | ||
Revision as of 17:27, 27 May 2013
A table like object, a collection of columns and rows, that displays data.
You can add to a table object any number of Date, Text and Value columns needed.
By default, the data displayed in the table will be grouped by the Data and Text columns and Value columns will be summarized.
For crossed data features in tables, see Cross Table.
Example
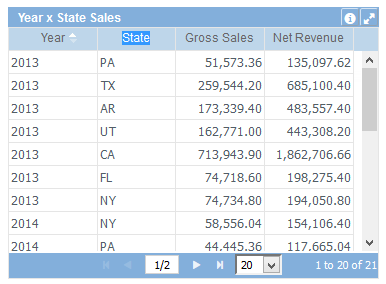
The above example, shows a table grouped by the Year and State columns (two first columns) and the summarized amount of Gross Sales and Net Revenue for these groups.
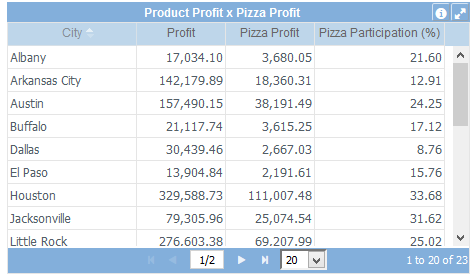
Other example, using modified Layout Properties, a filtered column that displays only the Pizza Product Profit and a expression to calculate the Pizza Profit percentage participation.
Data Properties
Title Bar Properties
Layout Properties
Object Columns Properties