Difference between revisions of "Execute a Dashboard/en"
(Importing a new version from external source) |
(Importing a new version from external source) |
||
| Line 24: | Line 24: | ||
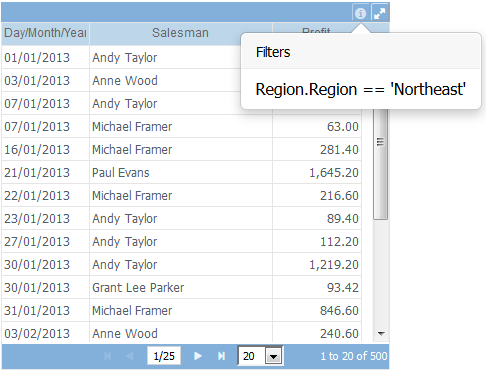
| − | To view objects applied filters, select the [[File: | + | To view objects applied filters, select the [[File:Filtros.png]] icon: |
[[File:Executando um Dashboard 2+en-US.PNG|link=]] | [[File:Executando um Dashboard 2+en-US.PNG|link=]] | ||
Revision as of 17:42, 21 September 2017
To run a dashboard click on it in the Dashboards list.
The resolution of the dashboard in run time was previously defined by the Dashboard dimensions property. Because of this the dashboard may be not fit perfectly on your device.
To exit the dashboard screen and return to the Main Page, click the File:Exit icon.png icon on the top right of the screen.
To view one object in full screen, click the maximize ![]() icon. To exit full screen, click the restore
icon. To exit full screen, click the restore ![]() icon.
icon.
You can enable and disable charts series by clicking on its labels.
Some objects, like Table and Cross Table, have a footer that shows rows information, navigation through pages commands and number of rows per page setting:
If the dashboard you are executing have Combo (Filter) objects you can interact with those to dynamically change the dashboard's data.
To view objects applied filters, select the ![]() icon:
icon:
