Execute a Dashboard
To run a dashboard click on it in the Dashboards list, from the main screen.
The resolution of the dashboard in run time was previously defined by the Dashboard dimensions property. Because of this the dashboard may be not fit perfectly on your device.
While a panel is running, the top bar with some options/informations will be displayed.

The options are:
- Dashboard name
- Date and time of last data update
- Print button: Generates a PDF file with the current image of the panel, thus allowing it to be printed as well as emailed, etc.
- Edit dashboard button: Available when you own the dashboard or have write permission on a dashboard that has been shared with you. Clicking this option will display the design screen for you to make modifications to the dashboar.
- Share button: If dashboard was created by you, you can share it with others by using this option. Remember that to use dashboard sharing you need to have this feature (Shared users) contracted in your subscription.
- Exit button: To stop a dashboard from running and return to the main screen or dashboard design
To view one object in full screen, click the maximize ![]() icon. To exit full screen, click the restore
icon. To exit full screen, click the restore ![]() icon.
icon.
In graphics, you can enable and disable charts series by clicking on its labels.
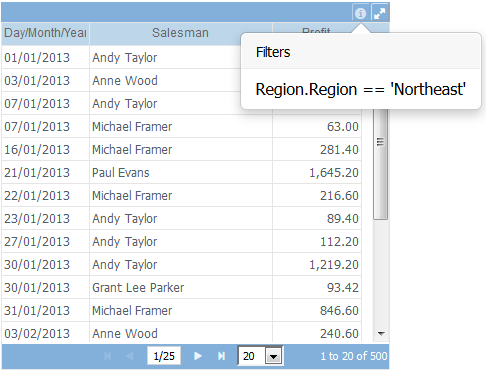
Some objects, like Table and Cross Table, have a footer that shows rows information, navigation through pages commands and number of rows per page setting:
.
If the dashboard you are executing has Combo (Filter) objects you can interact with those to dynamically change the dashboard's data.
To view objects applied filters, select the ![]() icon:
icon:
